• Skip to content
  • Skip to primary sidebar
  • Skip to secondary sidebar

Bitcoin currency trading | Bitcoin trading bot | Profit Trailer |Gunbot

Bitcoin Trading Today

Header Right

Profit Trailer- Bitcoin Cryptobot that makes lots of money!

Profit Trailer- Bitcoin Cryptobot that makes lots of money!

Uncategorized

Trading View tutorial- using ADX and DI to identify peaks and reversals

April 26, 2019 by admin Leave a Comment

Trading View tutorial- using ADX and DI to identify peaks and reversals

ADX and DI- on trading trading view- a detailed trading view guide using my free special ADX script.

This is part of a series of articles and videos I will be doing on some of the best free and open source indicators on Trading View (you will need an account here to access this particular script) and how I use them plus some of the traditional tried and tested methods.

If you want to watch the video version of this article please click here.

In this particular article will look at ADX and DI  aka Average Direction Index. And how I use it to trade BTC-USD, ETH-USD on exchanges such as Bitmex and Deribit

ADX is a a popular tool to determine the strength and direction of a trend. There are numerous ways ADX can be used, but I will explain clearly and succintly several ways I have used ADX, and in particular the script I have published on trading view which is based on this one , but has a number of minor tweaks and improvements.

The new ADX script can be accessed here.

The RSI A/D Script can be accessed here.


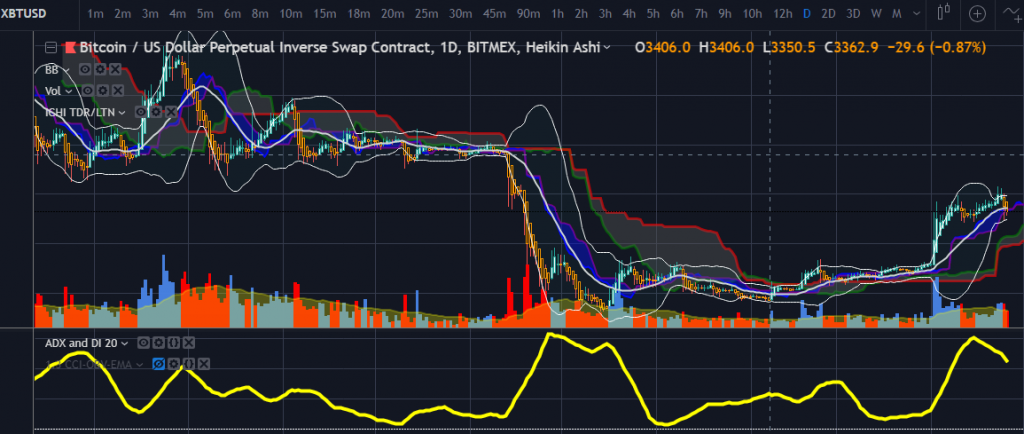
Essentially ADX has three components, the ADX line (it’s yellow on mine)

and a Positive direction- (DI+) and Negative direction (DI-)

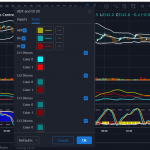
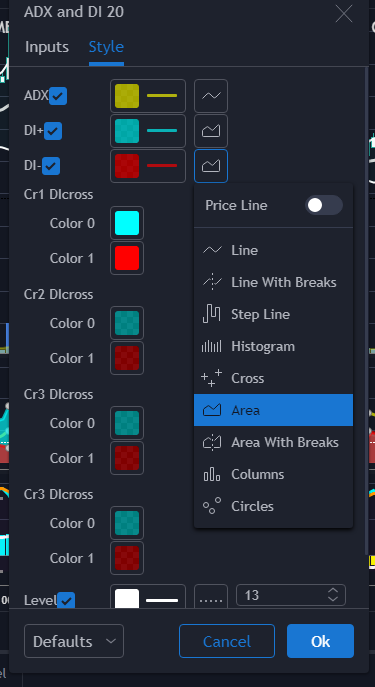
Most people have the DI+ and DI- as lines, though I prefer to have them as an “area” (see the picture as to how to set this).

The reason why I like to see an area instead of lines is it allows me to visualise them as almost like clouds which expand and contract.


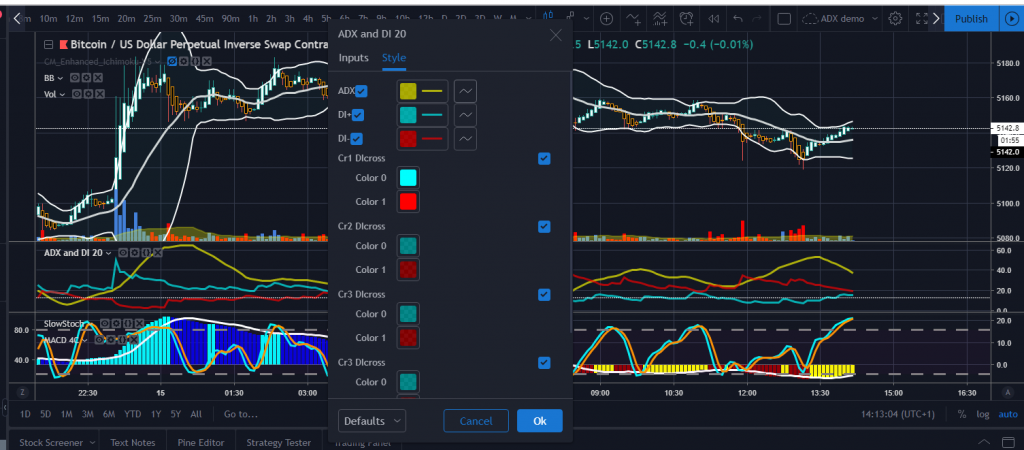
The second thing is the ADX length. 14 is a pretty balanced default length to use. I also at times use 10, but in general I like using 20 (occaisionally I’ve used 30 as well but it can be a little slow). The difference between them should be apparant, 10 is much faster and more reactive 20 is slower.

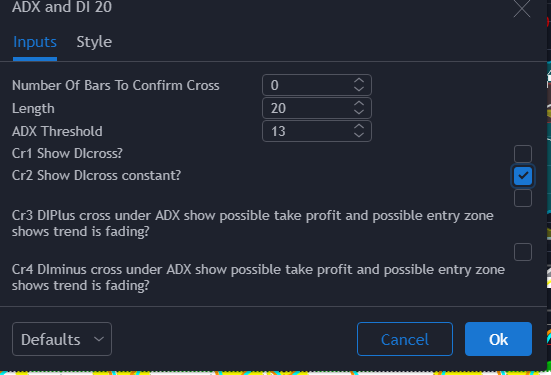
Another optional step you can take is to tick the boxes for cr1 and cr2 (note that cr3 and cr4 are experimental only and I haven’t tested them thoroughly so I don’t reccommend using them yet) these will highlight signal shifts on the indicator panel.

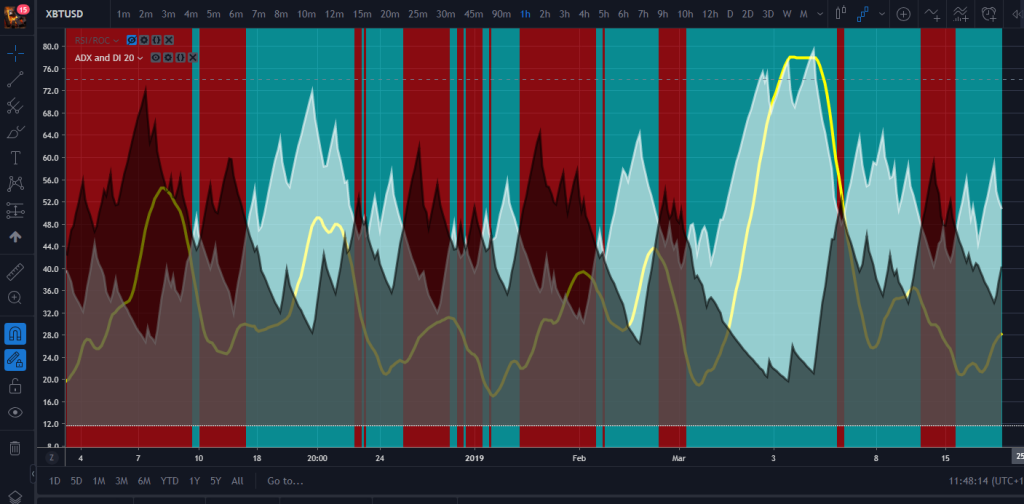
The box which sayd ADX threshold is a filter, which if applied means you will have a minimum ADX line reading for the indicator to show a trend. This means if you set it to 13, if the ADX yellow line is below 13, no DI + or DI – is shown because the trend is too weak. If you want this disabled set it to 0.

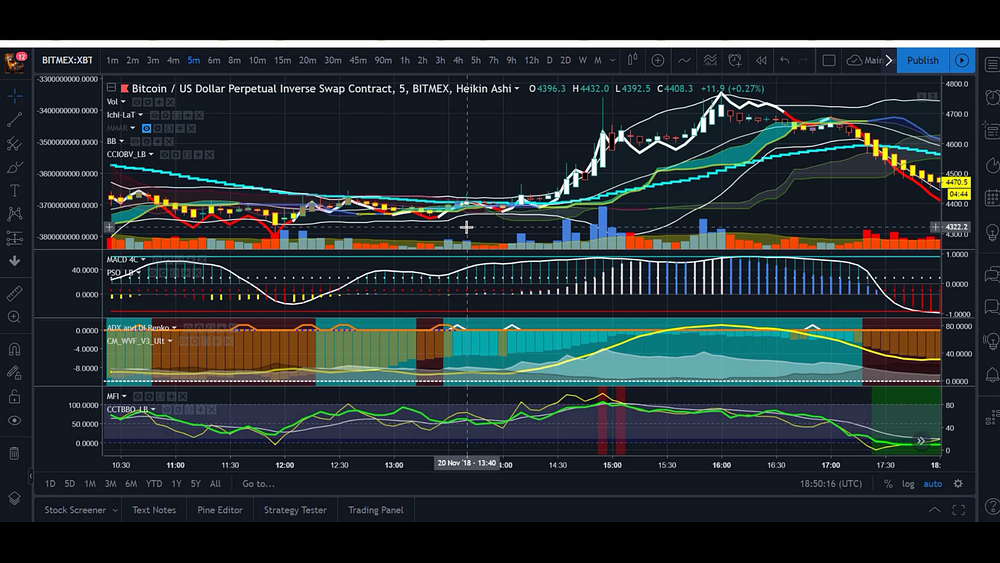
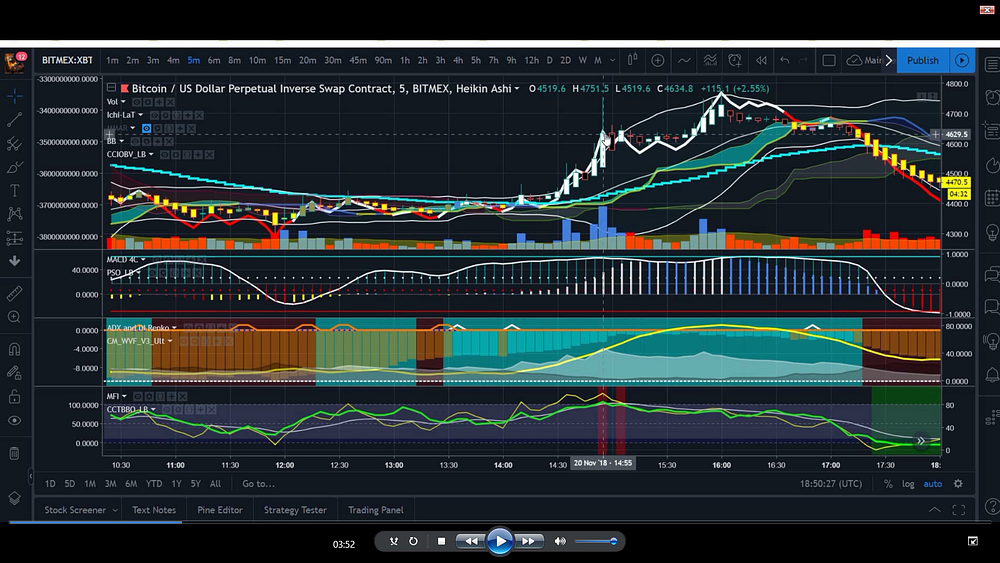
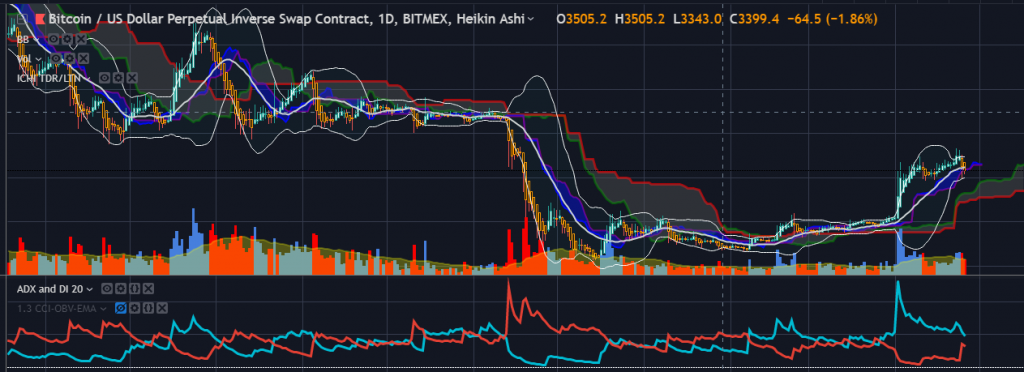
The two examples below show the difference between the filter being on or off, when the cr2 box is also ticked (so that we can clearly see if the trend is negative or positive).

1.ADX filter applied- notice how the regions where ADX is weak are blacked out.

2.ADX filter off- All regions shown regardless of ADX strength.


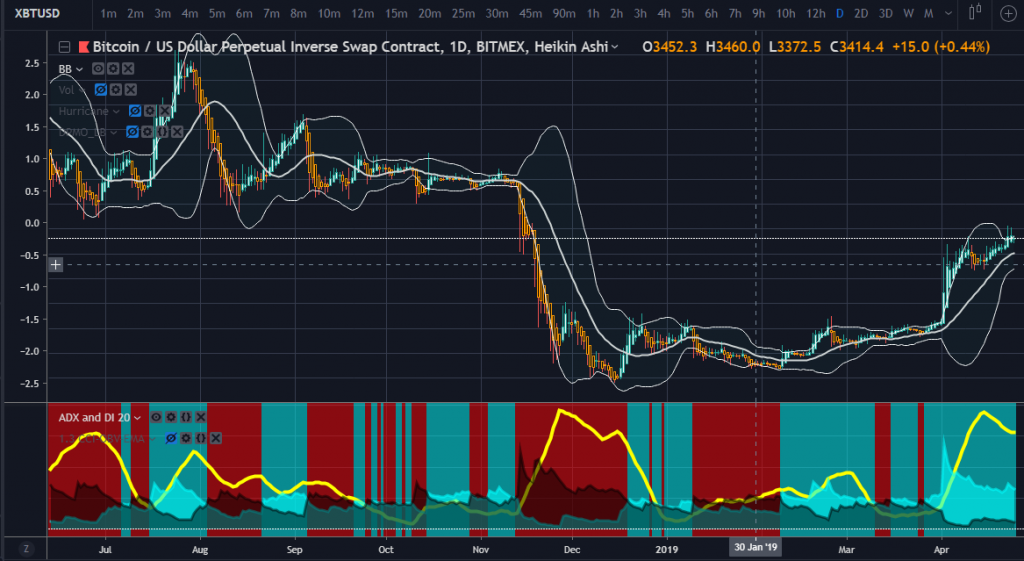
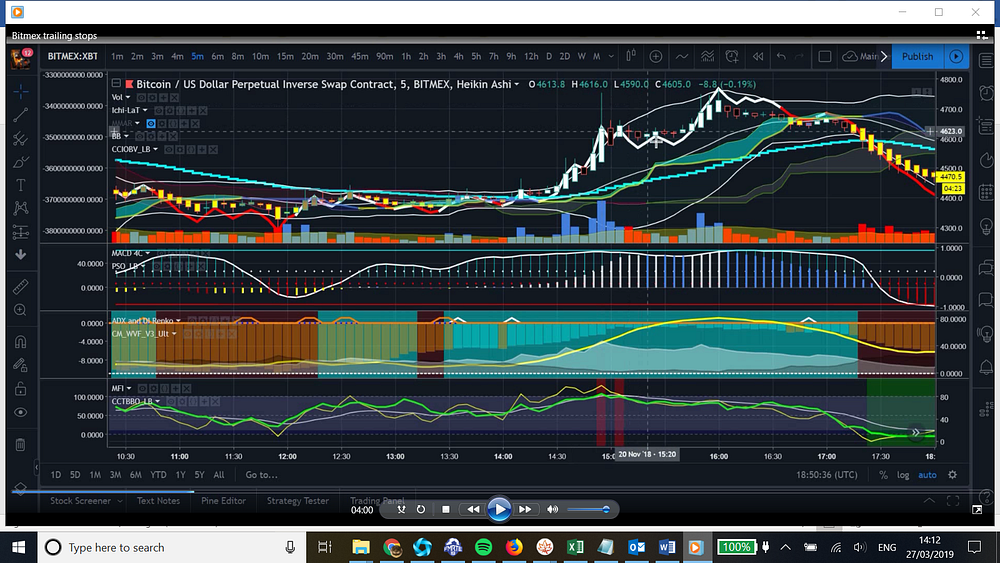
Cr1 shows when either DI+ or DI- crosses over becoming the new dominant trend. The crossover from one trend to another is shown with a coloured column- of which the colour will be set in the style section- for demonstration purposes on mine, an aqua column shows a shift from negative to positive trend and a red column appears from positive to negative.


Cr2 is similar to cr1 except instead of a column of light the background colour is a constant. This allows you to see clearly if the trend is positive or negative throughout a length of time. Although you can also set an alert on trading view for cr2, if you are going to use alerts for cr2 ensure you only use “Once only” rather than “Once per bar” or “Once per bar close” (please watch the video for a more detailed explanation) otherwise the alert will fire every single candle it is true. Cr1 is better for alerts “Once per bar” or “Once per bar close” since it only fires upon condition change of DI+ turning to DI- and vice versa. Once per bar close is also generally safer as it means it will wait for a candle to finish forming and condition to be true upon the new candle before firing.

The main setups on Trading View using ADX

Traditionally people will use the ADX line and avoid trading when it is low, and showing a weak trend. A typical value range of ADX is about 0 to 80, but this depends on the length you set it at, and the timeframe.

The main setups I like to look at are when ADX are twofold- essentially we’re looking for when the main ADX yellow line rises, peaks then falls. ADX is very much like the tide of the ocean, the more you watch it, the more you will be able to watch the ebb and flow of it like a tide that can help you decide when a trend is likely to be over, fade or begin to switch to a new trend. Sometimes you can even get your entry based on the Yellow ADX line peaking at a very large reading and then dropping (which often a reversal)


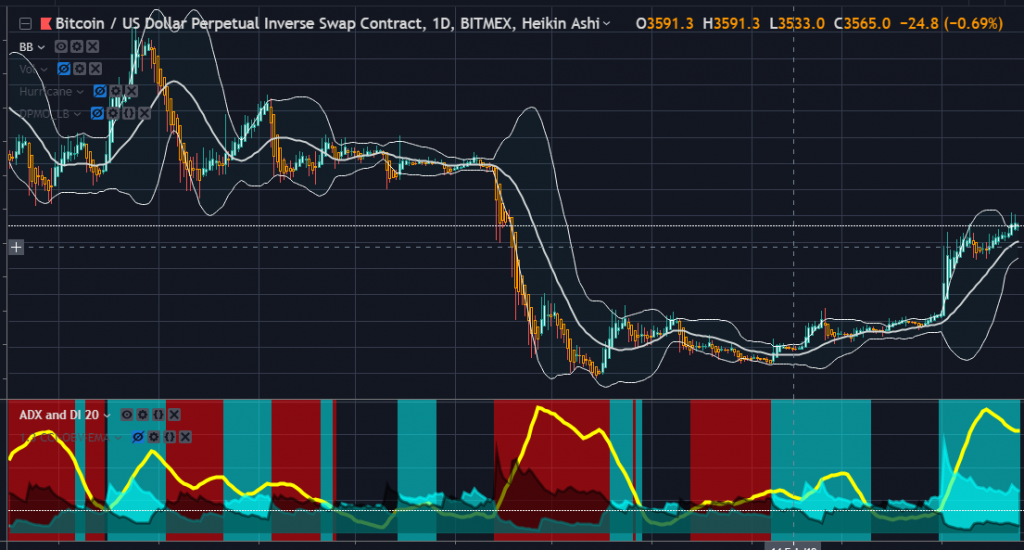
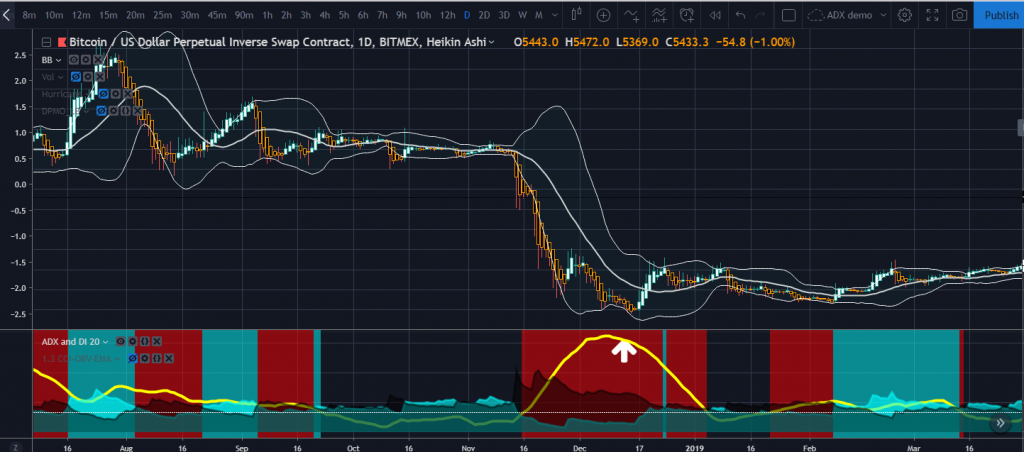
Casestudy #1 the week commencing 17th of December 2018.

The first setup we’ll look at is on the daily and 2 day chart -note that the 2 day chart is a custom timeframe, I have it as it can be very useful when comparing side by side to the daily. Remember it’s always good practice to view things on multiple timeframes, because you need to see the overall context of something which is happening on a smaller and then larger scale. 


What we are looking at is the point in which the yellow ADX line curves up then starts to fade. You will also see the difference between setting length at 14 or 20. I generally prefer 20 because it can help you determine the peak or trough better. On occaision I have even used 30 (however if you use 30 the line moves quite slowly, on some higher timeframes it will not be particularly active at all)


This is ADX on the daily timeframe to length 14. Notice how the bulge initially peaks late November (the exact date is the 27th) and there is a brief initial rebound where we see up candles. ADX then briefly fades before

ADX on the daily set to length 14

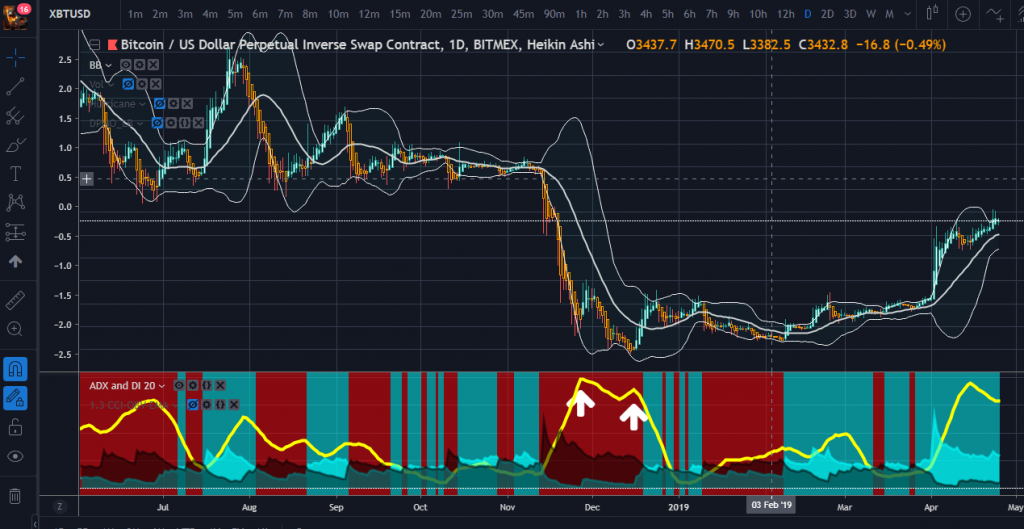
Daily candles set to length 20. notice how the curve is smoother than when set to 14, and a very strong rebound only takes place on the 17th after the curve has peaked and then starts to fall. I took a long position on the afternoon of the 17th as I was watching this the whole time during the huge crash of November/December and knew that at some point it would rebound.

Casestudy #2

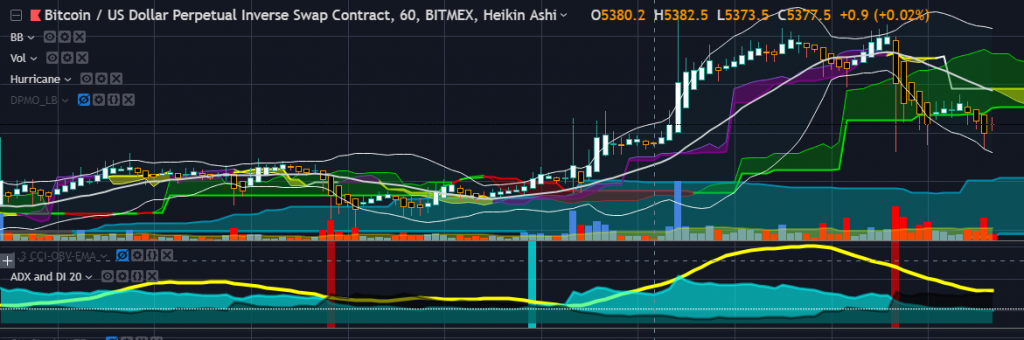
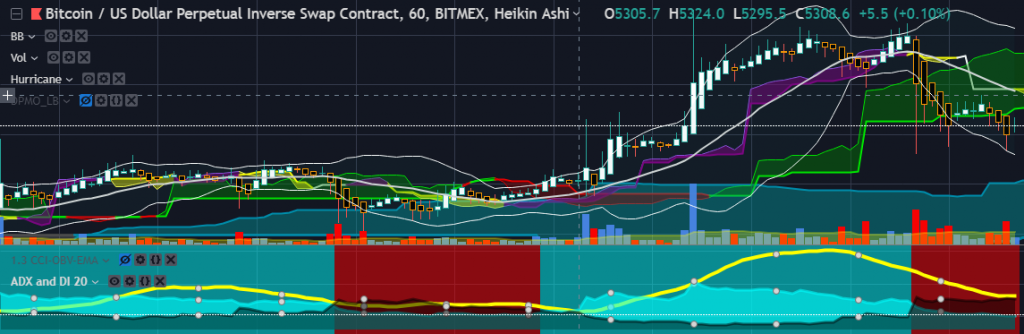
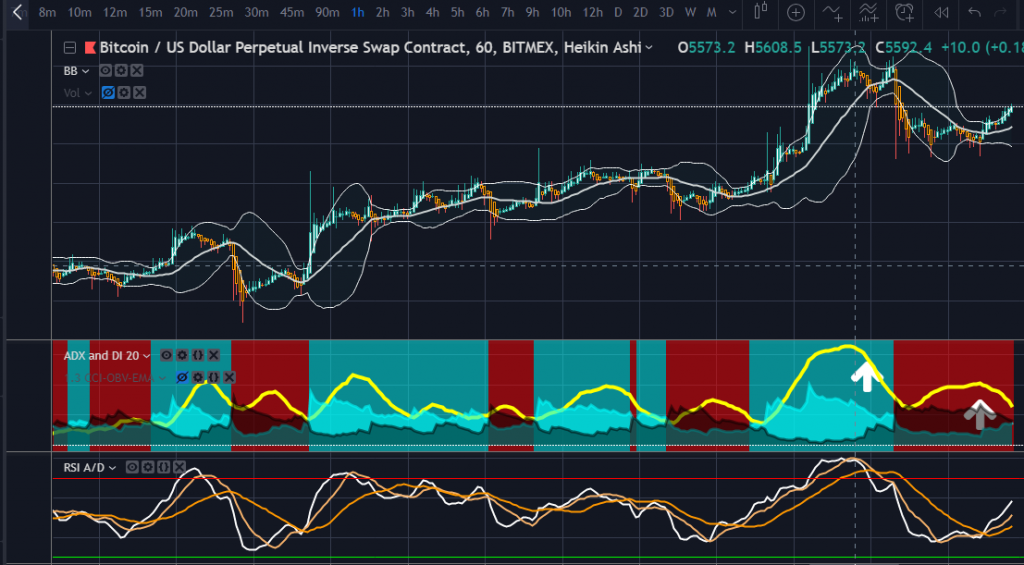
Now we can zoom into the hourly chart to look at the more recent price action of April 24th and April 25th

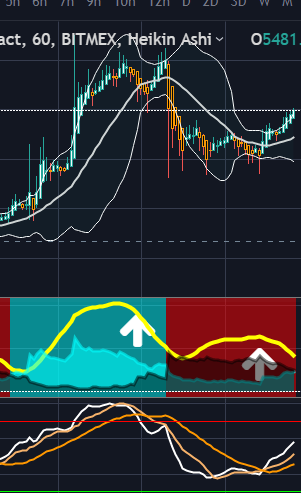
Notice a couple of things. Now this is an interesting example of when when price movements are quite strong in both directions and an uptrend very quickly turns into a nosedive. At times you will notice (particularly with something as volatile as Bitcoin) they almost fuse into each other.

The second thing to note is that, at the end of the uptrend there was a final push up (this is almost certainly a stophunt or big players messing with the market) which forced price up one last time before taking a nosedive. Hence at times you must be careful not to be caught out with this. 

Understanding ADX requires some nuanced reading at times- of course just because the ADX line has peaked does not neccessarily mean you need to enter immediately; sometimes there will be a final break (or two) the other way (typically this is probably stop hunting or big players playing games to trap people into weak positions before the real move)

Always use an additional confirmer where you can look for divergence such as RSI. In my example I am using another special modified indicator which is RSI and Accumulation/Distribution strength. It is basically an edit of this script CM EMA of RSI  by Chris Moody

The main difference between my one and the original is that there is an additional Accumulation & Distribution line as well as two additional faster SMAs that straddle the RSI and EMA of RSI line.

What I do is watch the faster lines as they cross over the slower lines, this gives me an idea of if something is likely happening beneath the surface. Watch as they cross over each other.

I go through several more quick examples on the video.


Once again big thanks and shoutout to Squiggles whom without I would not have been able to make the edits to Pinescript. Visit his Youtube channel here

If you don’t have a Trading View Account sign up here.

For a Bitmex account

Deribit

I do have a private coaching programme that I’m currently redeveloping (I may be putting some of my programme on Udemy or another platform eventually), where I go through some of these in more detail plus a system I use to trade renko bars with. If you want to enquire please send me an email at ippp0031@gmail.com


Filed Under: Uncategorized Tagged With: Accumulation Distribution, ADX, ADX and DI, Bitmex leveraged trading, RSI, Trading View, Trading view tutorial

How I use trailing stops on Bitmex to exploit pumps and dumps: an advanced Bitmex Stop Loss tutorial.

April 11, 2019 by admin Leave a Comment

How I use trailing stops on Bitmex to exploit pumps and dumps: an advanced Bitmex Stop Loss tutorial.

How I use trailing stops on Bitmex to exploit pumps and dumps: an advanced Bitmex Stop Loss tutorial.

This article is an edit of the transcript of this video which I made on Youtube, click here to view it.

I have also published it on medium here:

The video explores the use of a trailing stop, a special type of Stop Loss on Bitmex when doing leveraged trading as well as other types of stop order, how to use them, the difference on setting them on a long and short and the types price trigger, amongst other things.

Signup for Bitmex here:

The trailing stop on Bitmex can be really useful because if used effectively you can (and I have done this quite a few times) to exploit pumps and dumps.

A trailing stop will ensure that if price keeps on going up and up and up on a long, or down and down on a short, it will exit with a market stop order at the point that suddenly reverses by the amount you set (in the first example in the video this is 25).

On a very steep, sharp move often I’ll put the trailing a higher from 50 to 60. And what that does is really exploit a long wick whether it’s an upper or lower wick.

So I did this on the second week of the enormous crash of November 14th let’s go and have a look at the chart of some of the pumps and dumps I called almost perfectly.

This is the day the BTC started recovering off that huge huge dump a few days before. So what I did is I actually had a long entry on the afternoon of the 20th and I set the trailing stop about minus 45 and what we did was it down there and exited somewhere here (see hand curser). You see here this is the high. So my order exited around here.

and then I re-entered here (see the cross) and I put another trailing stop here and then it would have exited around the top of the candle.

I then put a short here. See if you’re going to do a trailing stop on a short you’ve actually got to do it the other way round. Because on a long trailing stop you’ve got to put a minus number in whereas on a short trading stop you’ve got to put positive number in because what you’re doing is you’re selling out a buying position or buying out a selling position. If it rises by X amount then you buy out your short position. You see here this is a huge crash and I put the short in and I put a trail of about 50 positive and actually exited here right near the bottom and as soon as I saw this candle here I put a log in and I caught this pump all the way out there and I put another training stop in so I basically got these five moves almost perfectly. And the trailing stop was so useful in doing that.

[00:05:28] Let me give me an example of how you would set a trailing stop. So here right now I’ve got a a long position. So on a long position you need to set the trail value to a negative so I know at the point where it’s suddenly drop by minus 30 you know then it will set a market order to sell.

[00:05:55] If this position is a short however you would put a positive number and the reason why is because you’re buying out that position to get you out of the short position. As you can see it will these numbers will move up and down accordingly.

[00:06:25] Server Overload & Using different types of stop losses

So I’m sure those of you who use Bitmex will have seen something that that happens quite frequently during volatility which is server overload. When that happens you can’t get an order filled. And I’ve had stop losses been missed before when I set just a stop limit when it’s overloaded. you know I was lucky I didn’t get liquidated on a couple of trades.

If you have a trailing stop that doesn’t matter so much actually (about having a separate stop loss) because the trailing stop can do two things. First thing is that you’re in a long and pumps say 150 dollars an event and then at the end of a 150 dollar pump it moves down by minus 30 or whatever you set it at then it would sell at that level (100 USD gain); so you make a decent profit; on the other hand if it doesn’t go up at all or if it goes up and only slightly but then it’s still then it goes down it goes against you then this will act as a stop loss as well. So you know so trying to stop can be pretty useful in all types of situations. It may however be less useful if your strategy is say over 4 hour, 6 hour, half day or daily candles.

NB: So some guys may be thinking you may get hit on fees using market orders. My opinion is this: (of course this depends on your strategy, I’m not including market maker/taker strategies of course). You’d be better off having a market stop and it fill for certain (and market buy/sell for entry in some circumstances) rather than having risk your order not be filled. That’s not to say you should only use market orders (ideally you could use both, and for entries find a way to scale in) but a stop market or trailing stop (which fills at market) will not fail to get hit, better be safe than sorry. It does not have to move that far for you to be in break even if you were to have market orders on both the entry and exit.

Price trigger types.

[00:07:58] All right guys so when you set a stop there’s one last thing. So you’ll notice that there’s there’s a couple of options here so there’s some there’s trigger action and close on trigger.

So what this means is what is the price that you’re going to choose to base the stop on. I would say that if you’re going to use a trailing stop (or any stop for that matter) I use the last price because the last price is the actual price that’s been traded. So if you want to catch some of these wicks and take advantage of them I will use last price. I mean some people say that if you’re going to use a normal stop you’d be better off using Mark Price because the market price it does move a little slower and it’s less volatile but the thing is the mark price it does lag. So if you’re going to use a really fast mover like a trailing stop that I would not use mark price (which is absolutely useless for that) I’d use last price.

And you’re more than welcome to a second stop in the stop market or a stop limit with the mark price as well but I would observe how and when it triggers as the mechanism is very different. Just to be safe you know and play around with it and see what works best for you. But as I said you can use that I tend to use last price I’ve never used the Mark Price for trailing stop.

The close on triggers are: If you have it ticked you reduce and remove all your contracts from that position; you could also use it to enter a trade in the opposite direction you would uncheck this and you would actually increase the quantity value here since your stock could trigger an order in the other direction- to do that you will need to ensure you have enough margin left to cover the trade- this means you would need at least 50% maintenance margin to cover a pending order i.e. when you make your initial order you need to leave some balance in reserve to be able to make that pending order.

[00:09:45] Also to understand the close on trigger function having it ticked versus not ticked there are a couple of good posts on Reddit that I found. So this is one of them. This is basically saying close on trigger makes sure that it closes any open positions and doesn’t add to them in that direction. So if you’re long 100 contracts then you have an open order for another 50 that hasn’t already been hit and if you had close on trigger off and you had a sell of 150 as to stop loss they would have entered you in the other direction with 50 contracts in a short position. Now there’s some circumstances where if you want it close on trigger off it might be useful actually. So if you have the close on trigger box it doesn’t affect any other open orders.

[00:10:53] So this channel isn’t that new but I haven’t really made a lot content for it for what I will be doing is making a lot more videos over the coming weeks and months because there’s a lot of knowledge I’ve got and there’s quite a few things I’m going to share completely for free. I also have a trading view account where I’ve been publishing scripts I’ve only published a couple of things.

https://www.tradingview.com/u/ippp0031/

And what I will be doing is publishing some modifications of some well-known or some really good indicators and I’m explaining how I use them. I’ll also be explaining how I actually identified some of these tops and bottoms because you know for the last few weeks (In December) I’ve been practicing on low time frames using my micro accounts because it was so volatile.

[00:11:52] You can see (one of) my setups here though it looks pretty messy. But you know in a in a subsequent video I will explain to you sort of some key components. We’ve got the Bollinger bands we’ve got something that has been made by Lazy Bear which is CCI coded on balance volume. Now this is very very useful tool because you know this can really help you predict the trend/momentum of something you can have you know stay in a position which is going up you know you’ll find the pullbacks and you know when it’s dumping you know it can help you avoid a falling knife. I used the Ichimoku you know this is this is actually a special Ichimoku which I made but with a huge amount of help from my friend squiggles. I’ll put a link to his channel played a video here as well. Let me just highlight some of the stuff here. I don’t think he’s published this yet (or may not at all) but this Ichimoku is actually something very special It’s called Ichimoku Thunder and lightning. I told him about this because there’s a book by a Japanese trader called Ichimoku Thunder and Lightning and this is basically where know instead of the three lines you have you have a you have the tumor here and you’ve got a sort of you know lightning thunder strike which is fast moving so maybe we could do a joint video another time. This is this is an alternate stoch RSI and this is an alternate macd. I’ve also got a modified version of Chris Moody’s macd which I will publish some point so when I got the time and this is an ADX script that I’ve modified again with the help of squiggles.

 So this is really really useful because you go you know what I’ve got here is you can show the crosses where the lines that the plus and the minus lines cross each other. It also has this really useful feature which shows the background the constant color according to the trend. You could take most of your moves based on that alone and the line. I think a lot of people may not know how to use ADX properly I’ll make a separate video on that as well.

Now this one here this is this is really really interesting indicator. This is again this is made by Chris Moody. If you’re watching this Chris. Say hi I’ve sent you a message. He’s very difficult to get hold of. But this is basically the Wall Street volatility fear index. So you get all these bars light up and there’s this huge down volatility. And what I’ve done is I didn’t actually modify his script such but what I did was I found some alternate settings for it which I can explain at a later date because there’s the switch as well which you can flick on and make the candles glow molten and you can also show you the candles that you know where it’s going to cool down you see these green bars here you see a blue bar here in some circumstances these can be good entries depending on the situation. So yeah at a later date I will be going through these on different videos and also some different strategies on and also maybe some reviews and some explanations of the nuances and ins and outs of some of these exchanges. I want to provide to I want to provide to you information with quality and which will really help you. So yeah. So please subscribe to the channel and if you don’t have an account with Bitmex, Deribit, or Trading View already there’s a link below.

[00:16:13] I’m just gonna finish off with a summary of everything that we’ve gone through on this video. So when you’re in a long position the trailing stop must have a negative valuee.g. minus 50. If you’re on a short position the trading stop must have a positive value for a longer sweeping move and trading on candles or at least 60 minutes. I would use a higher stop size e.g. 50 60 or more that’s just from personal experience. You may want to play around with it and see what number you might come up with. But I’ve found from past experience that works. For scalping if you’re gonna be trading on short time frames you might want to use a smaller sizee.g. 25, 30 ish again none of these are scientific numbers. You know I would encourage you to play around with a little bit and maybe observe the charts on some pure candles and see what the price variation is for when something peaks and starts to turn the direction or bottoms out in a start to go the other direction. And trailing stop. Also acts as stock market. So if it doesn’t go in your favor it will still fire and finally use last price as this will enable you to catch and exploit the top or bottom of a wick if you set the stop based on Mark Price or index price that will lag All right guys so I’m going to give you a very special bonus if and if you decides to create another account or maybe you don’t have an account already for Big Macs. Using my link which is at the bottom of this video I will send you a special guide that explains my heikan Ashi setup and it’s got some information about how I use ADX which is the average directional index indicator. I can probably all send you the indicator as well. Actually the Williams Fix Fix Chris Moody made this brilliant indicator which is based on the fixed fix. Wall Street fear index and I play around with it and I come up with some alternative settings. So the guide that I have explains how I use that. I’ll probably go through some of this in a subsequent video anyway. But yeah I mean it’s a guide that I have actually sent coaching clients in a previous program. I’m developing a discord group at the moment is not public because I’m trying to put put together some of the old information I had in a structured and ordered way. You know there’s just a handful of people in it. People I know people that I’ve coached surely or you know ones who are there’s still a few people that I need to add into it.

Okay so one last thing before we go. So I do actually have a Web site depending when you’re watching this. Bitcointradingtoday.com You know the website may or may not be back online again. Or maybe you’re watching this months or years in the future. It’s already back online and built into a beautiful machine. So I’ve only just recently renewed the domain so theservice was offline for a little while and I haven’t really updated it much and they haven’t really built much around it but I do plan in long term to sort of put a lot of decent content on there and you know have a lot of different articles you know links to some of the indicators that I’ve edited and adapted on trading view and a general sort of training you free advice you know previous page section at one point. And so I guess this is my logo for the moment. You may recognize what they is you know basically that is an orca also known as the killer whale. I picked up because obviously you know there’s a lot talk of whales in the crypto world and I thought well you know what do we have a whale which is which is a killer whale because actually it’s a dolphin but it actually kills whales and sharks you know. So and So. So in my mind it’s it’s very beautiful creature. It’s also a good guy you know even though it’s pretty mean and you know they can take out white sharks and you know all kinds of other things. They’re known as Apex predators. You know nobody can beat them in the sea basically. But don’t forget to subscribe and share it et cetera et cetera and there will be a lot more content coming out in the near future Okay so one last thing before I go.

[00:21:14] I need to give a very special thanks and a shout out to my friend Nigel. Also known as squiggles. He has his own channel and platform on trading view and he’s one of the most knowledgeable people that I know in pinescript and he’s helped me out so much there’s gonna be a few videos in the future where I demonstrate some of the stuff that he’s helped me build and he’s also got some absolutely fantastic indicators that he’s created himself so I’ve put a link to his channel and his trading view profile below, in case you want have a look at what he’s done and want to get in touch with them. As I said in the future there’s going to be things that I’m gonna be demonstrating that he’s helped me build you know such as this very special Ichimoku which I spent quite a few weeks on. And you know without his knowledge you know this is when I was still learning point scripts I would not have been able to put it together and you know there’s a new in an ADX and the I scripts special Macd and a few other things as well. So I will catch you soon then.

Bitcointradingtoday.com youtube channel:

Bitcointradingtoday
What is Bitcoin|Bitcoin explained A channel about Bitcoin, cryptocurrency and its history, buying Bitcoins, Bitcoin…www.youtube.com

Signup for Bitmex:

Website:

Bitcointradingtoday.com

Squiggle’s channel for expert Pinescript tutorials

https://www.youtube.com/channel/UC4O-W0DfsAfPYPbxws2dIOw

Signup for Deribit:

Get a Trading View account:

My trading view profile:

https://www.tradingview.com/u/ippp0031/

Disclaimer: this video does not in any way constitute financial advice, it is an opinion or for entertainment purposes. Leveraged trading is risky and you may sustain heavy losses. Always do your due diligence.

Filed Under: Uncategorized Tagged With: Bitmex, Bitmex leveraged trading, Bitmex stop loss, bitmex tutorial

Profit Trailer Bot, Bitcoin trading, Crypto trading

January 19, 2018 by admin 1 Comment

This site will cover how to use Profit Trailer, technical analysis, Trading View amongst I’m not really a day trader, but I take occaisional manually bought positions each week, particularly using the best Crypto bot currently out there- which is Profit Trailer. Profit Trailer is a bot with an excellent development team and functionality and I let it do most of my trading for me. See my detailed Profit Trailer strategy guide and review article on medium, which is a repost of this article originally from this site.

I will also be discussing cryptocurrency exchanges, ICOs, technical analysis amongst other things.

Filed Under: Uncategorized

Primary Sidebar

Categories

  • Uncategorized

Pages

  • Profit Trailer- Bitcoin Cryptobot that makes lots of money!

Secondary Sidebar

Copyright © 2023 · Lifestyle Pro on Genesis Framework · WordPress · Log in