ADX and DI- on trading trading view- a detailed trading view guide using my free special ADX script.
This is part of a series of articles and videos I will be doing on some of the best free and open source indicators on Trading View (you will need an account here to access this particular script) and how I use them plus some of the traditional tried and tested methods.
If you want to watch the video version of this article please click here.
In this particular article will look at ADX and DI aka Average Direction Index. And how I use it to trade BTC-USD, ETH-USD on exchanges such as Bitmex and Deribit
ADX is a a popular tool to determine the strength and direction of a trend. There are numerous ways ADX can be used, but I will explain clearly and succintly several ways I have used ADX, and in particular the script I have published on trading view which is based on this one , but has a number of minor tweaks and improvements.
The new ADX script can be accessed here.
The RSI A/D Script can be accessed here.
Essentially ADX has three components, the ADX line (it’s yellow on mine)
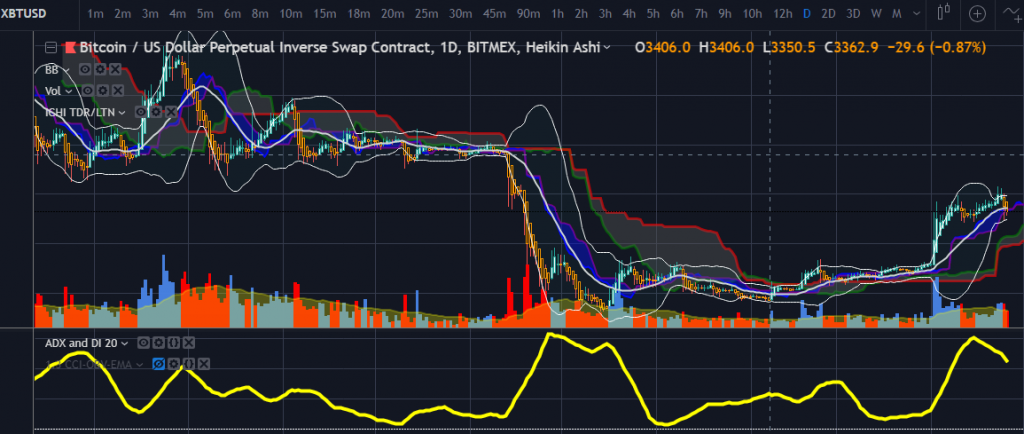
and a Positive direction- (DI+) and Negative direction (DI-)
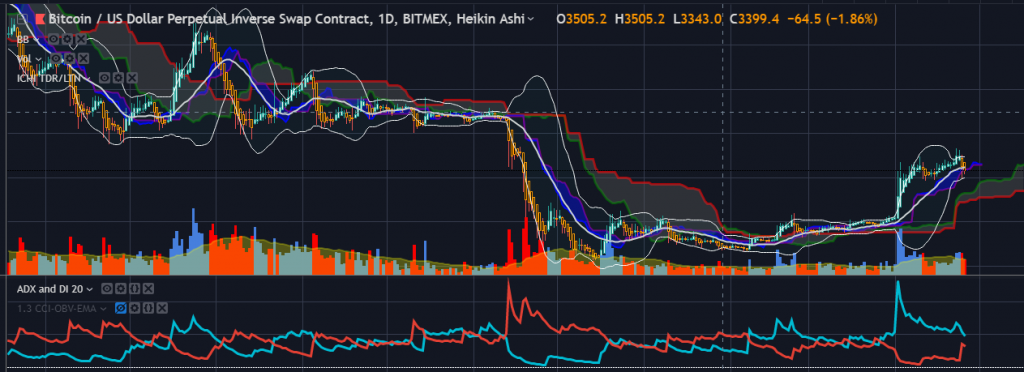
Most people have the DI+ and DI- as lines, though I prefer to have them as an “area” (see the picture as to how to set this).
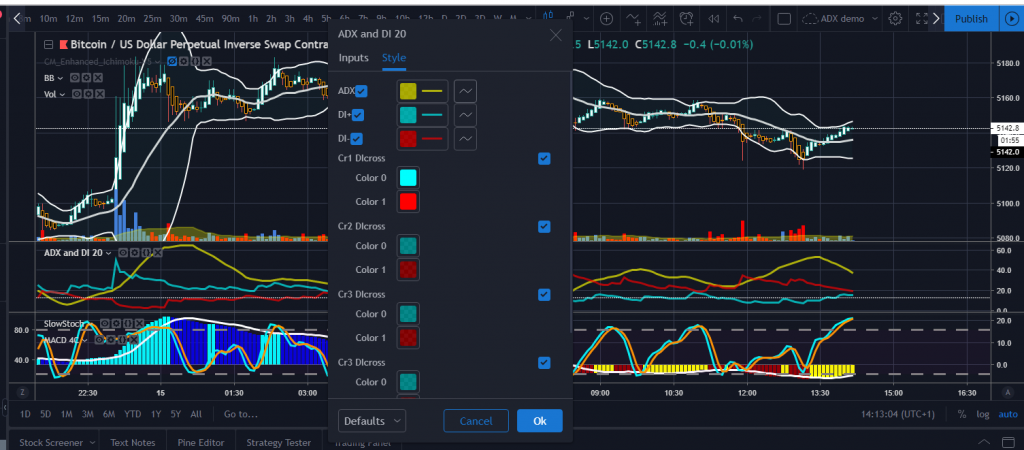
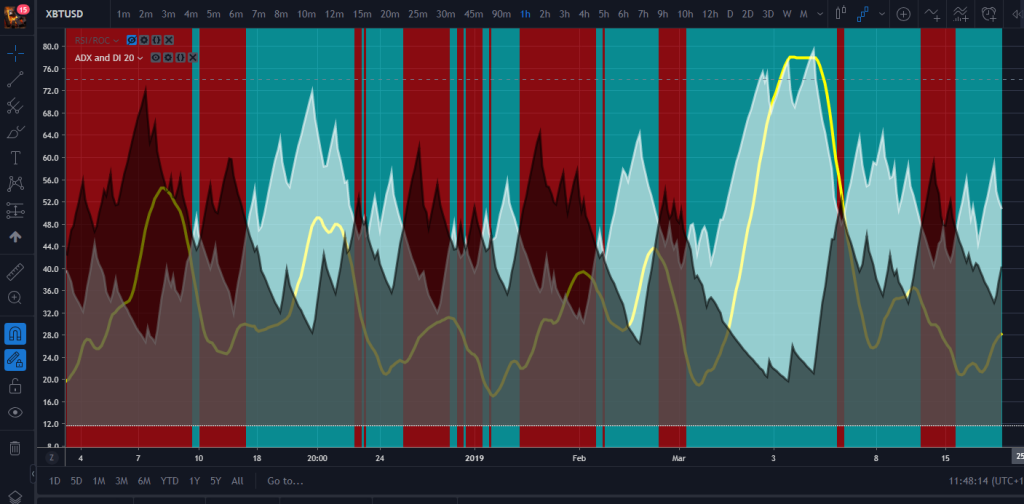
The reason why I like to see an area instead of lines is it allows me to visualise them as almost like clouds which expand and contract.
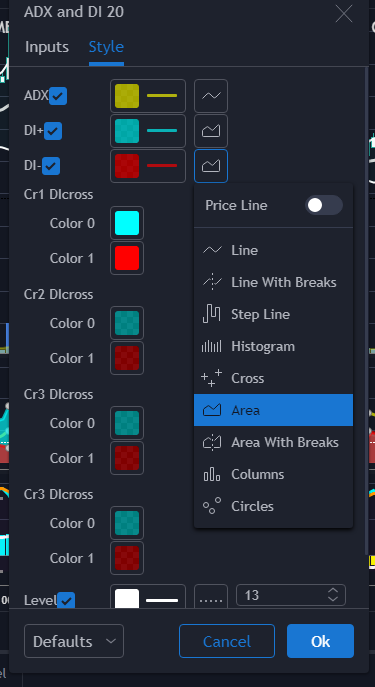
The second thing is the ADX length. 14 is a pretty balanced default length to use. I also at times use 10, but in general I like using 20 (occaisionally I’ve used 30 as well but it can be a little slow). The difference between them should be apparant, 10 is much faster and more reactive 20 is slower.
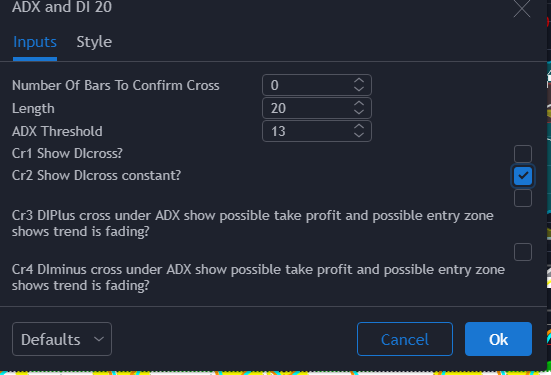
Another optional step you can take is to tick the boxes for cr1 and cr2 (note that cr3 and cr4 are experimental only and I haven’t tested them thoroughly so I don’t reccommend using them yet) these will highlight signal shifts on the indicator panel.
The box which sayd ADX threshold is a filter, which if applied means you will have a minimum ADX line reading for the indicator to show a trend. This means if you set it to 13, if the ADX yellow line is below 13, no DI + or DI – is shown because the trend is too weak. If you want this disabled set it to 0.
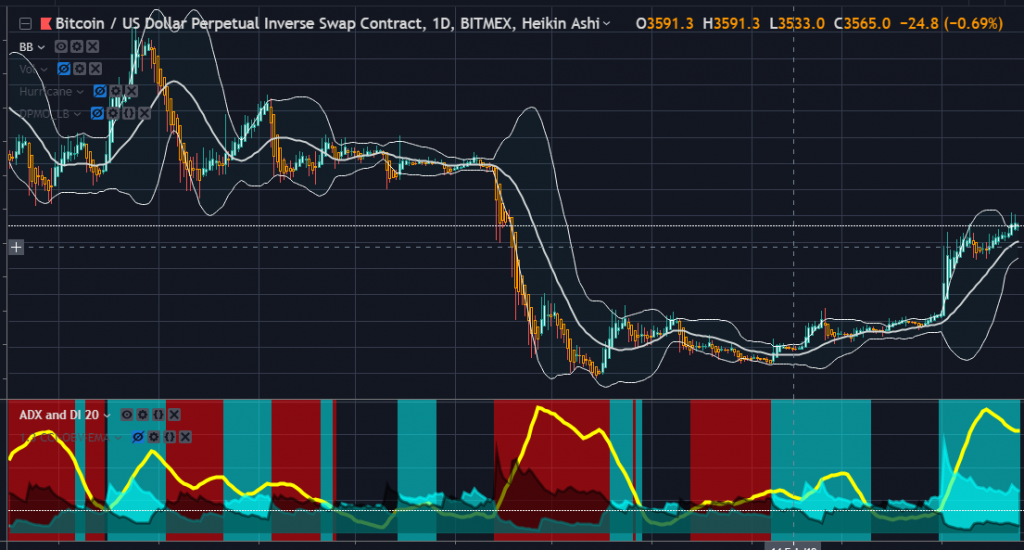
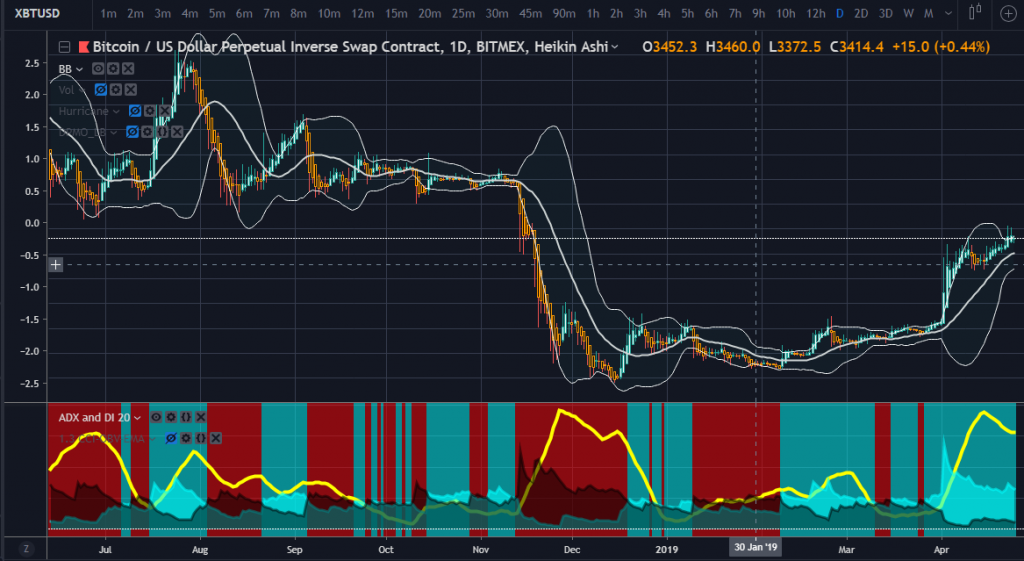
The two examples below show the difference between the filter being on or off, when the cr2 box is also ticked (so that we can clearly see if the trend is negative or positive).
1.ADX filter applied- notice how the regions where ADX is weak are blacked out.
2.ADX filter off- All regions shown regardless of ADX strength.
Cr1 shows when either DI+ or DI- crosses over becoming the new dominant trend. The crossover from one trend to another is shown with a coloured column- of which the colour will be set in the style section- for demonstration purposes on mine, an aqua column shows a shift from negative to positive trend and a red column appears from positive to negative.

Cr2 is similar to cr1 except instead of a column of light the background colour is a constant. This allows you to see clearly if the trend is positive or negative throughout a length of time. Although you can also set an alert on trading view for cr2, if you are going to use alerts for cr2 ensure you only use “Once only” rather than “Once per bar” or “Once per bar close” (please watch the video for a more detailed explanation) otherwise the alert will fire every single candle it is true. Cr1 is better for alerts “Once per bar” or “Once per bar close” since it only fires upon condition change of DI+ turning to DI- and vice versa. Once per bar close is also generally safer as it means it will wait for a candle to finish forming and condition to be true upon the new candle before firing.

The main setups on Trading View using ADX
Traditionally people will use the ADX line and avoid trading when it is low, and showing a weak trend. A typical value range of ADX is about 0 to 80, but this depends on the length you set it at, and the timeframe.
The main setups I like to look at are when ADX are twofold- essentially we’re looking for when the main ADX yellow line rises, peaks then falls. ADX is very much like the tide of the ocean, the more you watch it, the more you will be able to watch the ebb and flow of it like a tide that can help you decide when a trend is likely to be over, fade or begin to switch to a new trend. Sometimes you can even get your entry based on the Yellow ADX line peaking at a very large reading and then dropping (which often a reversal)
Casestudy #1 the week commencing 17th of December 2018.
The first setup we’ll look at is on the daily and 2 day chart -note that the 2 day chart is a custom timeframe, I have it as it can be very useful when comparing side by side to the daily. Remember it’s always good practice to view things on multiple timeframes, because you need to see the overall context of something which is happening on a smaller and then larger scale.
What we are looking at is the point in which the yellow ADX line curves up then starts to fade. You will also see the difference between setting length at 14 or 20. I generally prefer 20 because it can help you determine the peak or trough better. On occaision I have even used 30 (however if you use 30 the line moves quite slowly, on some higher timeframes it will not be particularly active at all)
This is ADX on the daily timeframe to length 14. Notice how the bulge initially peaks late November (the exact date is the 27th) and there is a brief initial rebound where we see up candles. ADX then briefly fades before
ADX on the daily set to length 14
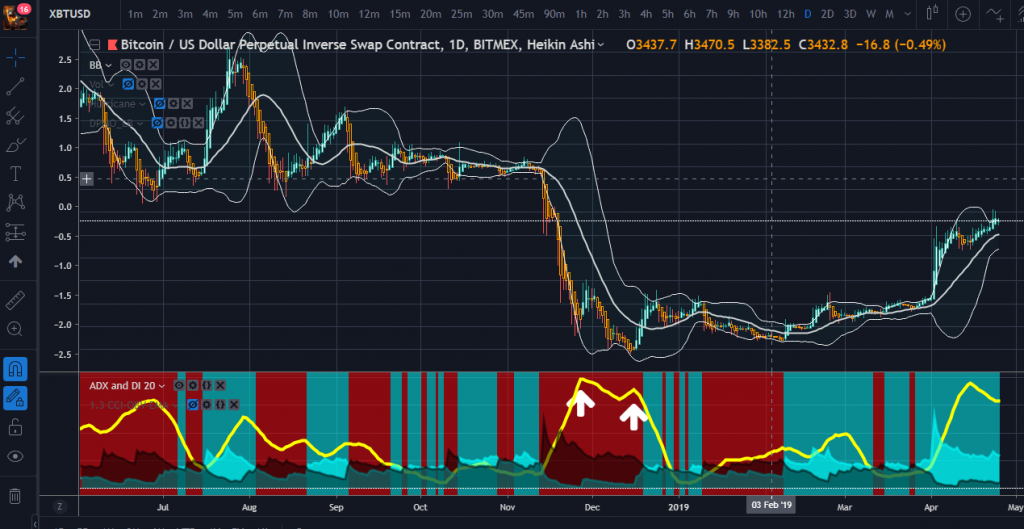
Daily candles set to length 20. notice how the curve is smoother than when set to 14, and a very strong rebound only takes place on the 17th after the curve has peaked and then starts to fall. I took a long position on the afternoon of the 17th as I was watching this the whole time during the huge crash of November/December and knew that at some point it would rebound.
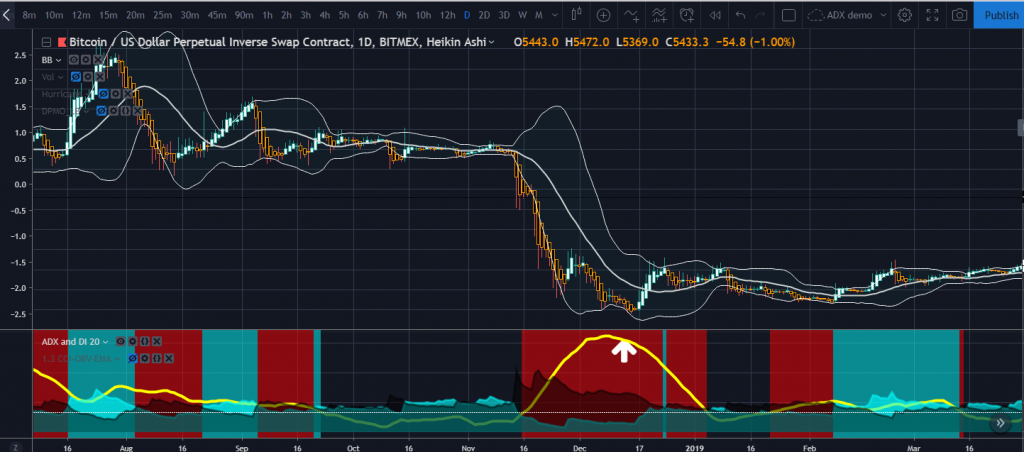
Casestudy #2
Now we can zoom into the hourly chart to look at the more recent price action of April 24th and April 25th
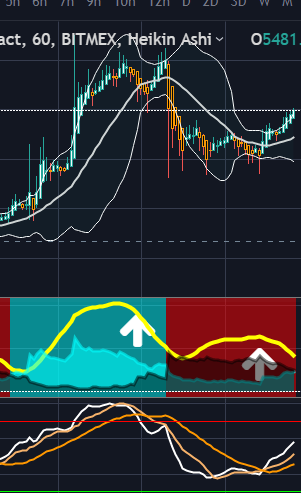
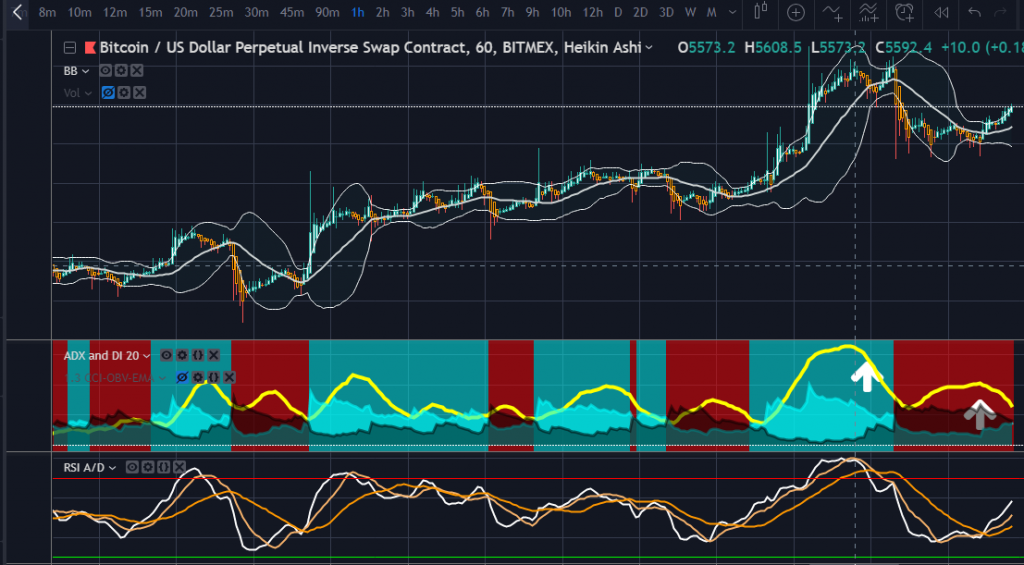
Notice a couple of things. Now this is an interesting example of when when price movements are quite strong in both directions and an uptrend very quickly turns into a nosedive. At times you will notice (particularly with something as volatile as Bitcoin) they almost fuse into each other.
The second thing to note is that, at the end of the uptrend there was a final push up (this is almost certainly a stophunt or big players messing with the market) which forced price up one last time before taking a nosedive. Hence at times you must be careful not to be caught out with this.
Understanding ADX requires some nuanced reading at times- of course just because the ADX line has peaked does not neccessarily mean you need to enter immediately; sometimes there will be a final break (or two) the other way (typically this is probably stop hunting or big players playing games to trap people into weak positions before the real move)
Always use an additional confirmer where you can look for divergence such as RSI. In my example I am using another special modified indicator which is RSI and Accumulation/Distribution strength. It is basically an edit of this script CM EMA of RSI by Chris Moody
The main difference between my one and the original is that there is an additional Accumulation & Distribution line as well as two additional faster SMAs that straddle the RSI and EMA of RSI line.
What I do is watch the faster lines as they cross over the slower lines, this gives me an idea of if something is likely happening beneath the surface. Watch as they cross over each other.
I go through several more quick examples on the video.
Once again big thanks and shoutout to Squiggles whom without I would not have been able to make the edits to Pinescript. Visit his Youtube channel here
If you don’t have a Trading View Account sign up here.
I do have a private coaching programme that I’m currently redeveloping (I may be putting some of my programme on Udemy or another platform eventually), where I go through some of these in more detail plus a system I use to trade renko bars with. If you want to enquire please send me an email at ippp0031@gmail.com

Leave a Reply